I was looking at US EPA’s P2 program yesterday, which has a very data-rich tool to identify potential opportunities to reduce the toxic release inventory across the US. The tool is called the “Pollution Prevention (P2) Environmental Justice (EJ) Facility Mapping Tool” [here’s the link to it].
There’s a lot going on with the web tool. Below is what the tool looks like. Notice how it’s map-based, and also notice that it shows the point locations of facilities as well as color coded areas that are based on EJSCREEN’s Demographic Index — to show the relationships between facility locations and communities that are potentially affected by the cumulative impacts of environmental pollution and socioeconomic factors.
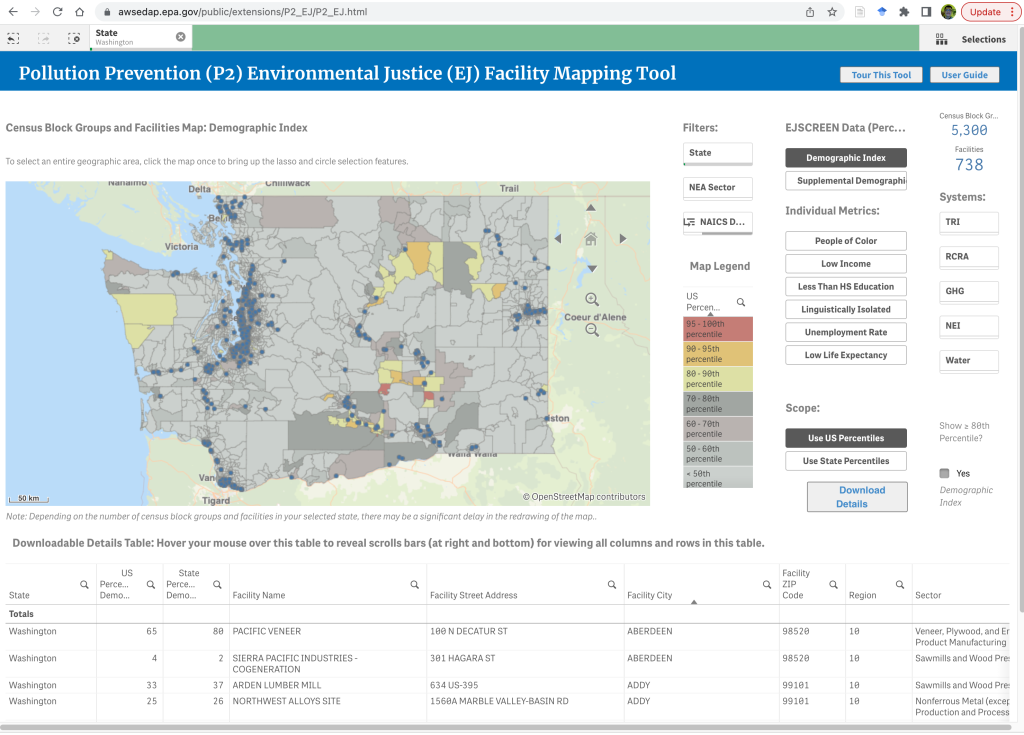
Here’s how I used the mapping tool:
- Where is says “Filters:” and “State“, I specified “Washington” as the state I’m interested in.
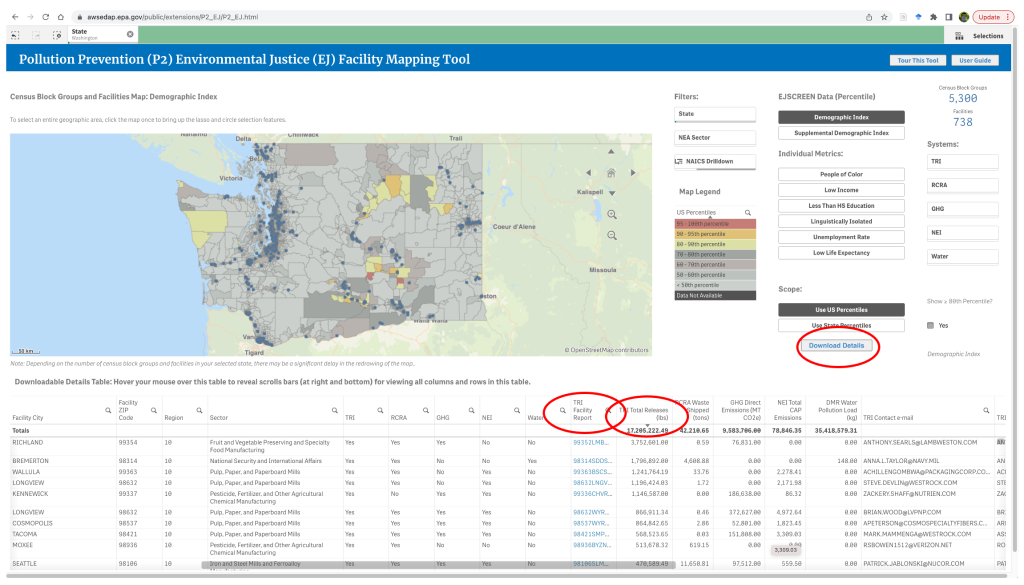
- I scrolled down to the table, and then scrolled to the right so that I could see the “TRI total releases” column.
- I clicked on the header for “TRI total releases” so that it’d sort by that column.
- Lo and behold! Out of the 17.2m lbs of toxics in the Toxics Release Inventory for the State of WA, 3.7m is reported by a single facility in Richland, WA that is in the “Fruit and Vegetable Preserving and Specialty Food Manufacturing” sector.
- I noticed that after that, there seemed to be a mix of different sectors in the top-10 facilties listed. To explore further, I pressed the “Download Details” button, which allowed me to get an Excel file of the results.
- In Excel, I sorted the TRI Total Releases column, and subtotaled by Sector.
- Interestingly, the “Pulp, Paper, and Paperboard Mills” sector accounted for the second largest category of TRI, representing approximately 30% of the toxics release inventory for the state. In the web tool’s table we can also see a few of those “Pulp, Paper and Paperboard Mills” show up in the top results.
- I noticed that in the web tool table, there’s a link to the “TRI Facility Report“. Clicking on that link shows a huge amount of details for specific facilities, including if they’ve had any recent violations and fines related e.g., to the Clean Air Act. It also shows if they’ve implemented previous P2 pollution prevention efforts, and the impact those efforts of reductions in their TRI.
This is a great tool to explore potential opportunities to reduce toxics in EJ communities.