There is great interest in community noise due to environmental justice concerns. In previous studies, we’ve demonstrated the associations between measured urban noise and roadway traffic, and the ability to model urban noise using traffic data in different US cities. In more recent work in Seattle, we’ve demonstrated citizen science process to collect and map high quality noise monitoring data.
Mapping noise can be useful in understanding where levels are elevated, but it does not tell the entirety of the noise story from an exposure point of view.
The Bureau of Transportation Statistics (BTS) maintains the National Transportation Noise Map for the United States here. These maps illustrate modeled noise levels for aviation only, roadway traffic only, rail only, and combinations of these noise sources.
Assigning noise exposures to census tracts is tricky because many of the pixels on the noise raster maps are “missing” or NULL values. Therefore, simply arithmetic averages will incorrectly assign noise exposures across the entire population of the census tract.
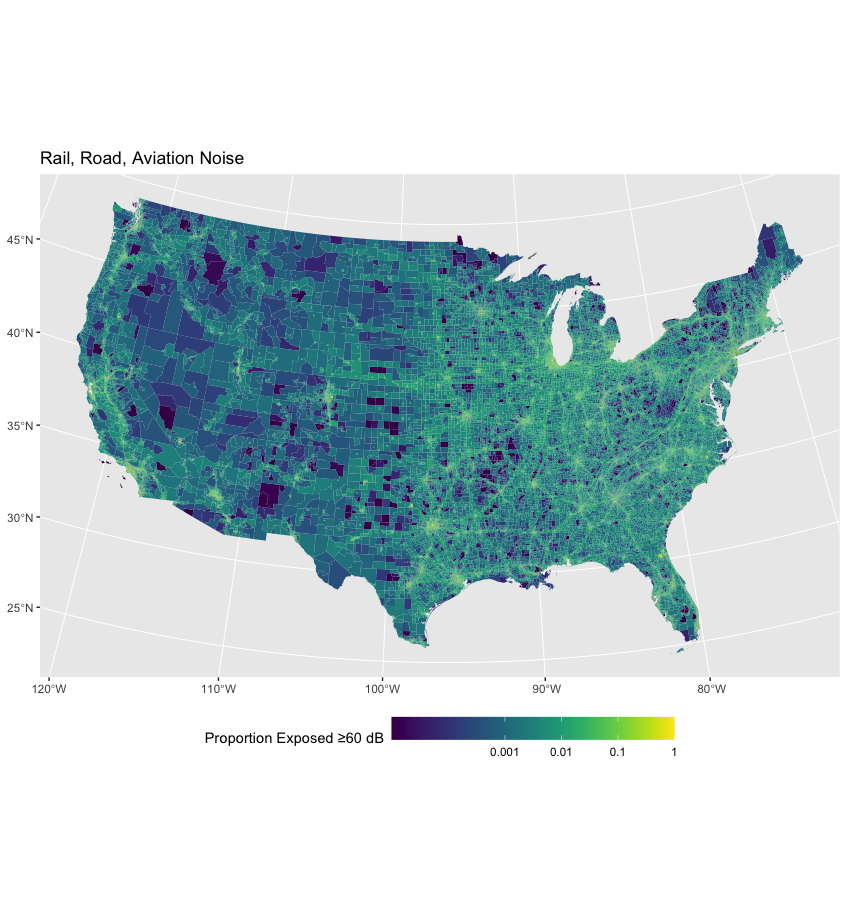
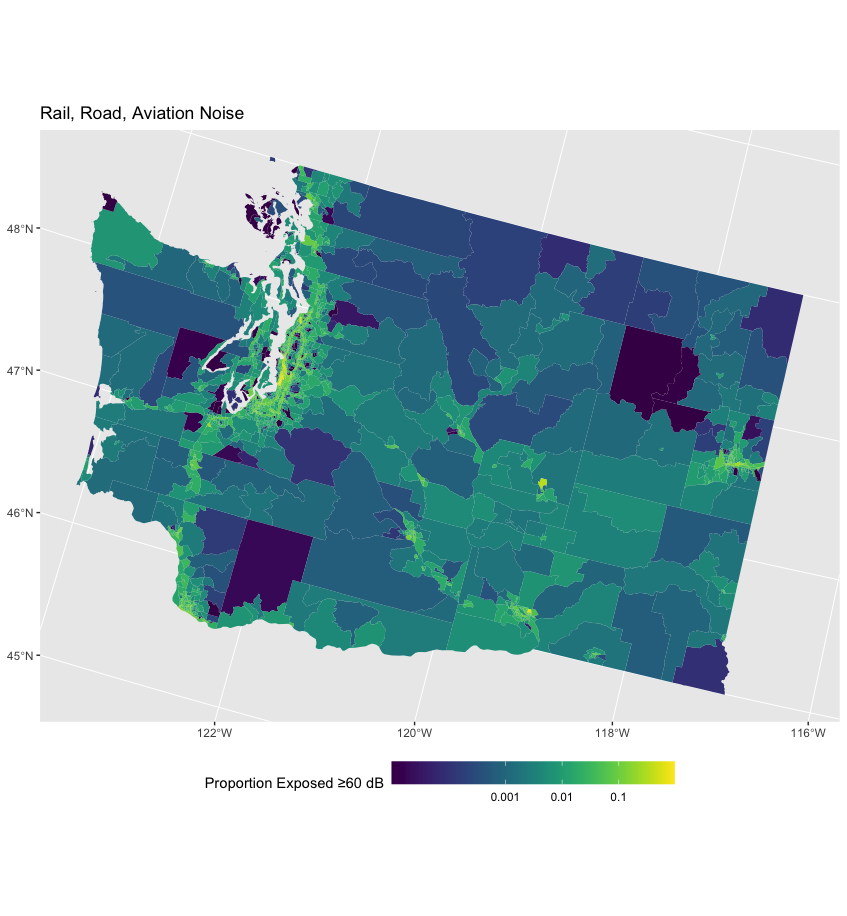
It’s better to account for areas of each tract that experience specific noise levels. In fact, this is how noise health impact assessments are conducted. i.e., we need to know what exactly what proportion of the population in each area is exposed to 40, 41, 42 dB, etc. We can then apply noise-health response functions for these population fractions.
I’ve generated these census tract-level maps for all of the United States. Here’s some initial work towards a noise exposure map for the United States and for Washington State.